| Navigation |
| About • Origins • Spread • Notable Examples • External References • Recent Images • Recent Videos |
About
LOLgraphs are statistical representations and visual aids typically designed to explain a wide range of non-academic and mostly trivial topics for humorous effect. In similar vein to Demotivational Posters, the format and concept of LOLgraphs has since become a unique genre of internet humor.
Origins
While the exact origin of using "silly graphs" remains debatable and may even precede the Internet, Jamphat.com/rap is widely cited as the first online project devoted to making graphs & charts about popular hip hop lyrics.
As early as in November 2007, a series of Microsoft Powerpoint and Excel charts breaking down the semantics of hip hop & rap lyrics began to surface on a single webpage operated under the domain of Jamphat.com[1]. Despite being hosted on a sub-domain web page, it has attracted nearly a million visits in two years via forwarded links, popular blogs and social news aggregators.
Spread
The popularity of Jamphat.com and its LOL graphs eventually gave way to the launch of several other spin-off projects, including Jay-Z Powerpoint Album[2] (Jay-Z's Black Album explained through LOLgraphs), RapGraph[3] (a concept blog featuring similar user-generated graphs on hip hop lyrics; the site is currently defunct), GraphJam[4] (the most active single topic blog hosting user-generated LOLgraphs on a wide range of topic subjects; it also offers LOLgraph generator) and This Is Indexed[5] (a personal blog run by Jessica Hagy showcasing her collection of humorous visual diagrams and graphs). In August 2009, single topic Tumblr I Love Charts[6] was created, which has over 5000 fans on Facebook as of November 2011.
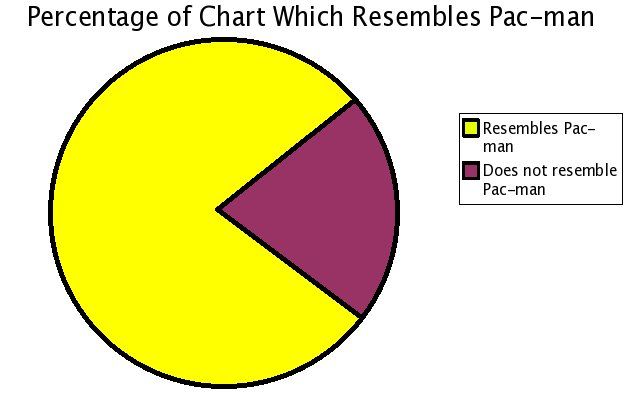
Notable Examples
External References
[1] JamPhat – Rap Represented in Mathematical Charts and Graphs
[2] Jay-Z Powerpoint Album – Slide 1
[3] Rapgraph – Rap Graph.comm Mathematical Charts and Graphs [now defunct]
[4] Graphjam – GraphJam: Music and Pop Culture in Charts and Graphs
[5] ThisIsIndexed – This is Indexed
[6] Tumblr – I Love Charts
Comments ( 20 )
Sorry, but you must activate your account to post a comment.
Please check your email for your activation code.